:no_upscale()/https://cdn.b2match.com/uploads/Cover_9e71066be7/Cover_9e71066be7.png)
Product update
Measure your event's pulse with the new admin Dashboard!
Nov 11, 20252 min read
We’re proud to introduce a feature that transforms event data into actionable intelligence: the all-new admin Dashboard!
We believe that organizing an event without clear metrics is like setting sail without a compass. You might be moving, but how do you know you're heading in the right direction? Now, you have a powerful command center to not only prove your event's ROI but also to steer its success in real-time.
From scattered data to clear insights.
Until now, piecing together the full story of your event’s engagement meant navigating between different reports and screens. It did the job, but it didn't give you the pulse of your event at a single glance.
The new admin Dashboard changes that. We've designed it to be your event's control panel, neatly organizing all the most critical metrics into a single, intuitive view.
You don’t need to dig for data any more. Now, you have an immediate, clear insight into what’s driving engagement and where your attendees are focusing their energy. It’s about giving you the clarity to make informed decisions, while the event is still happening.
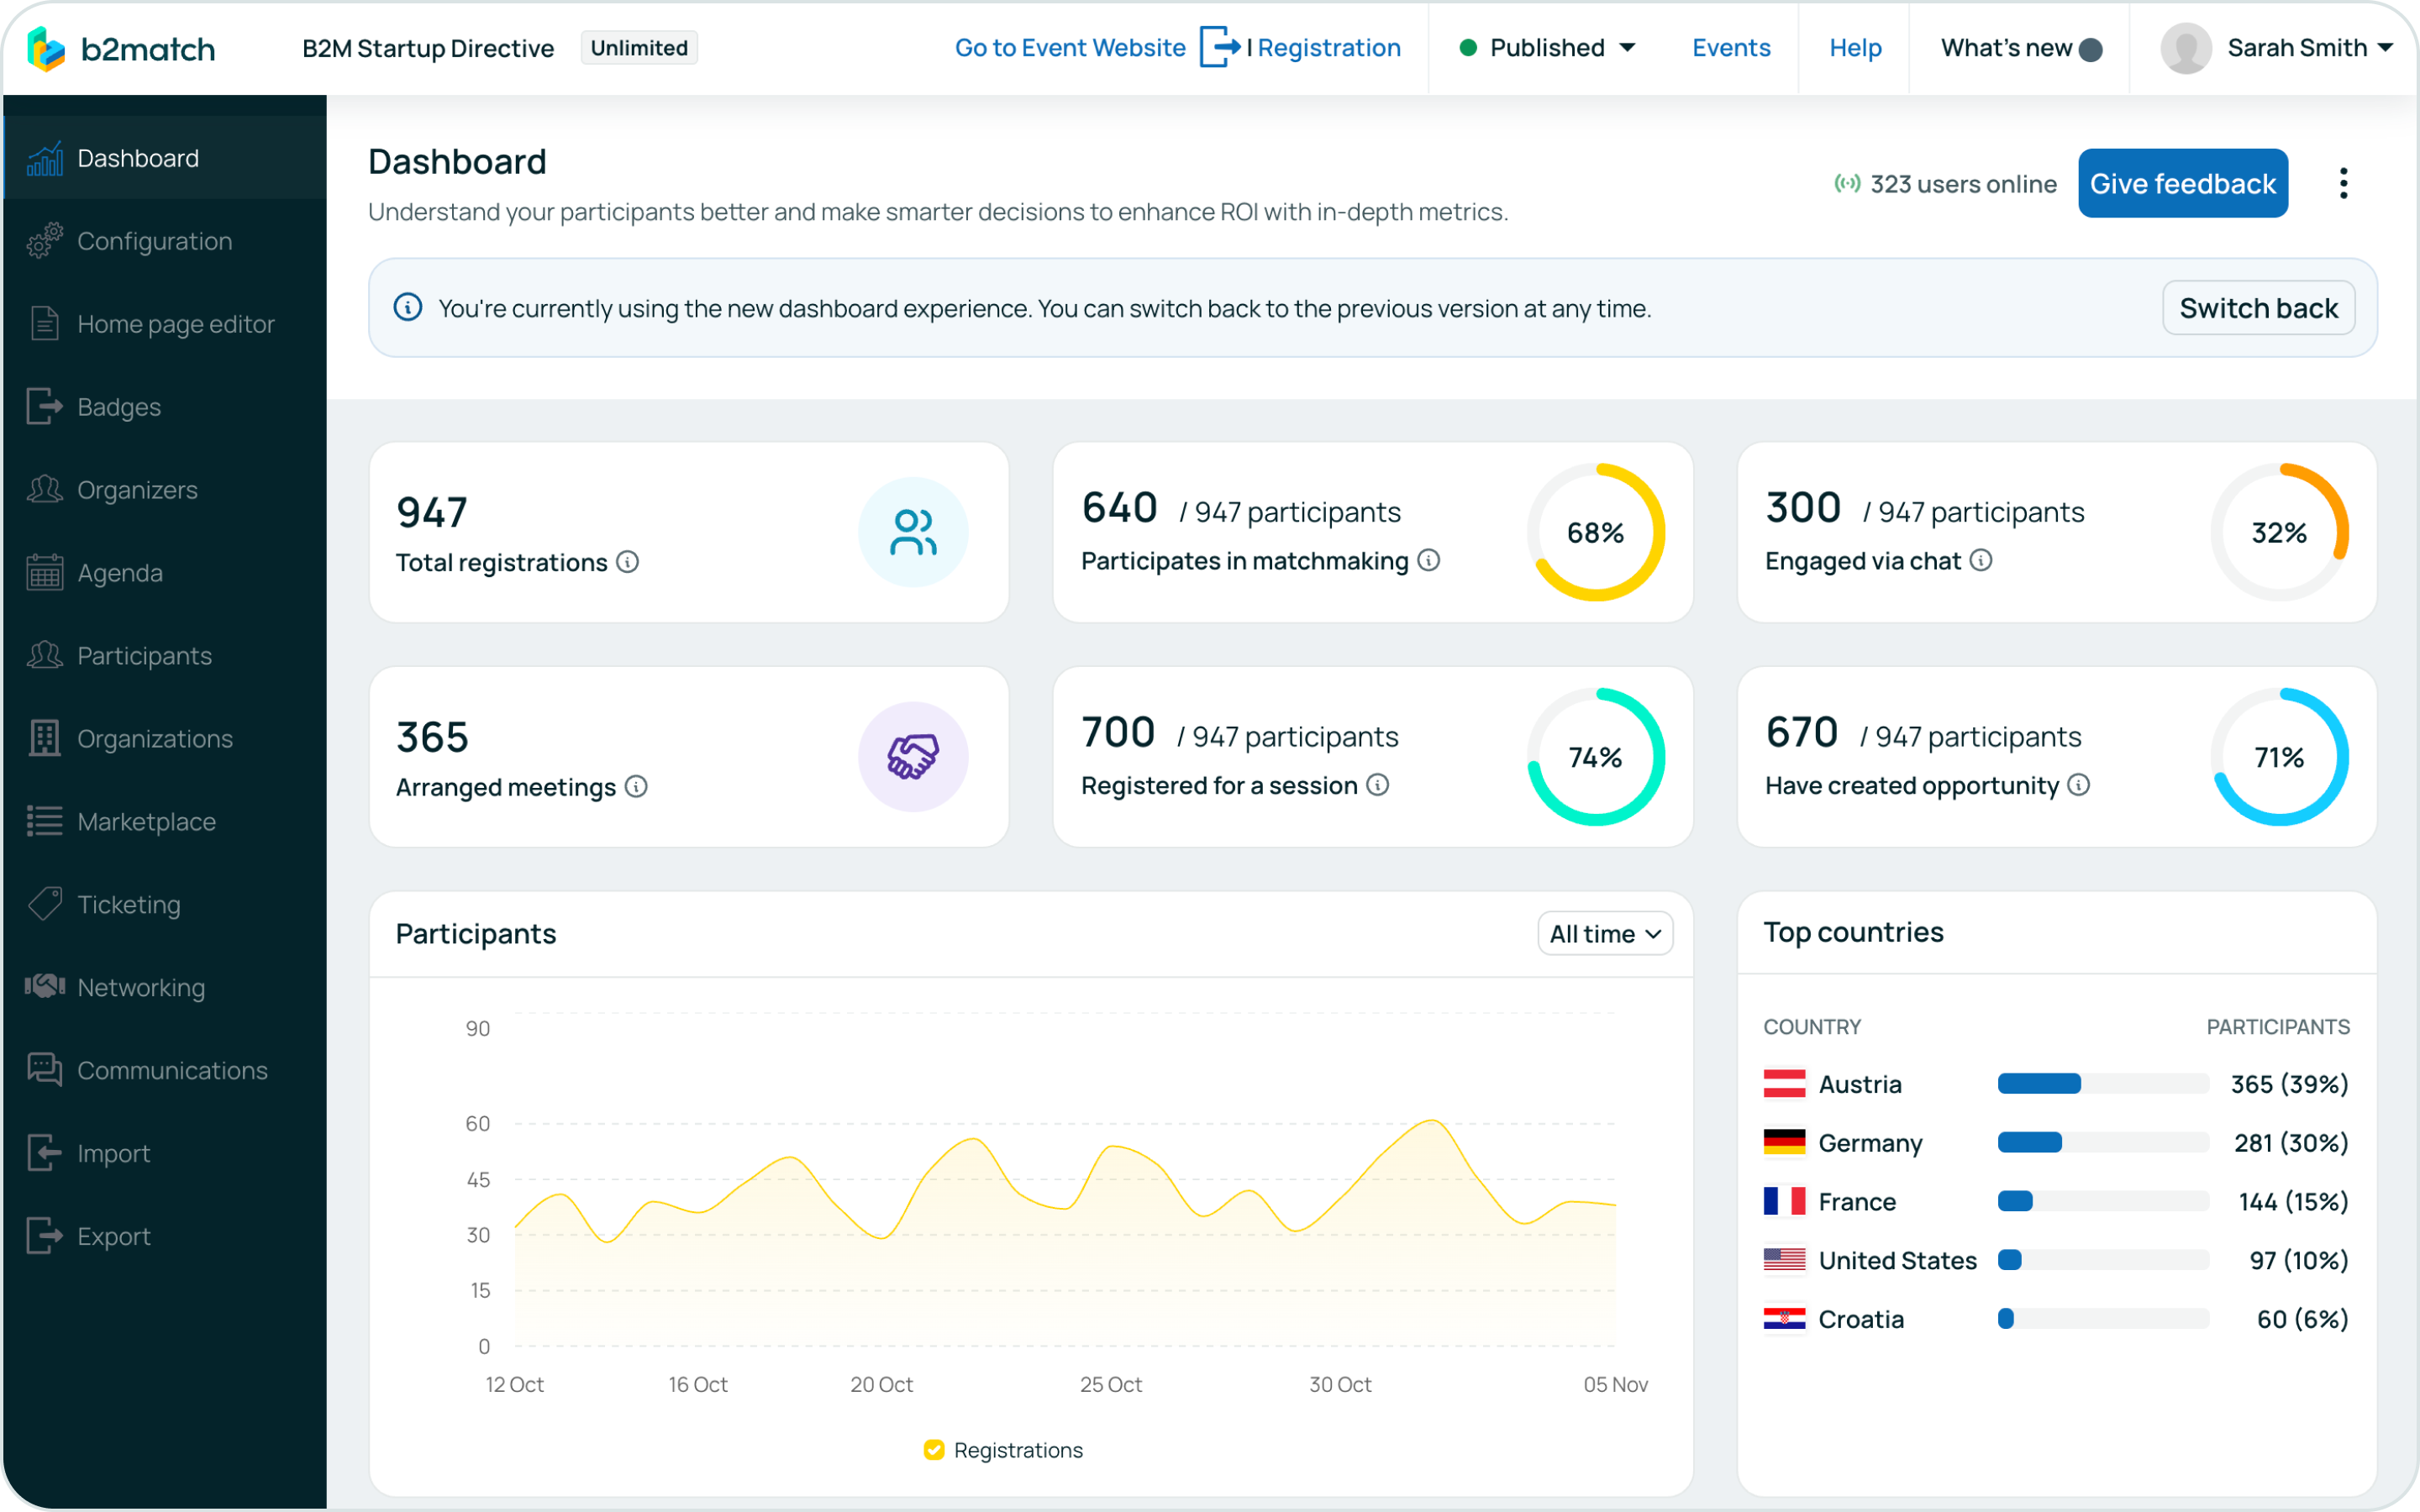
Your event's vital signs, at a glance.
The new admin Dashboard presents all your key performance indicators in easy-to-digest widgets. Here’s what you can track in one centralized hub:
- Core engagement metrics: Get an immediate snapshot of your event's vitality with the total number of registrations, the percentage of participants active in matchmaking and chat, arranged meetings, and session registrations.
- Participant analytics: Understand your audience with the Top Countries widget and track registration trends over custom time periods (last 7 days, current month, etc.) with the Participants graph.
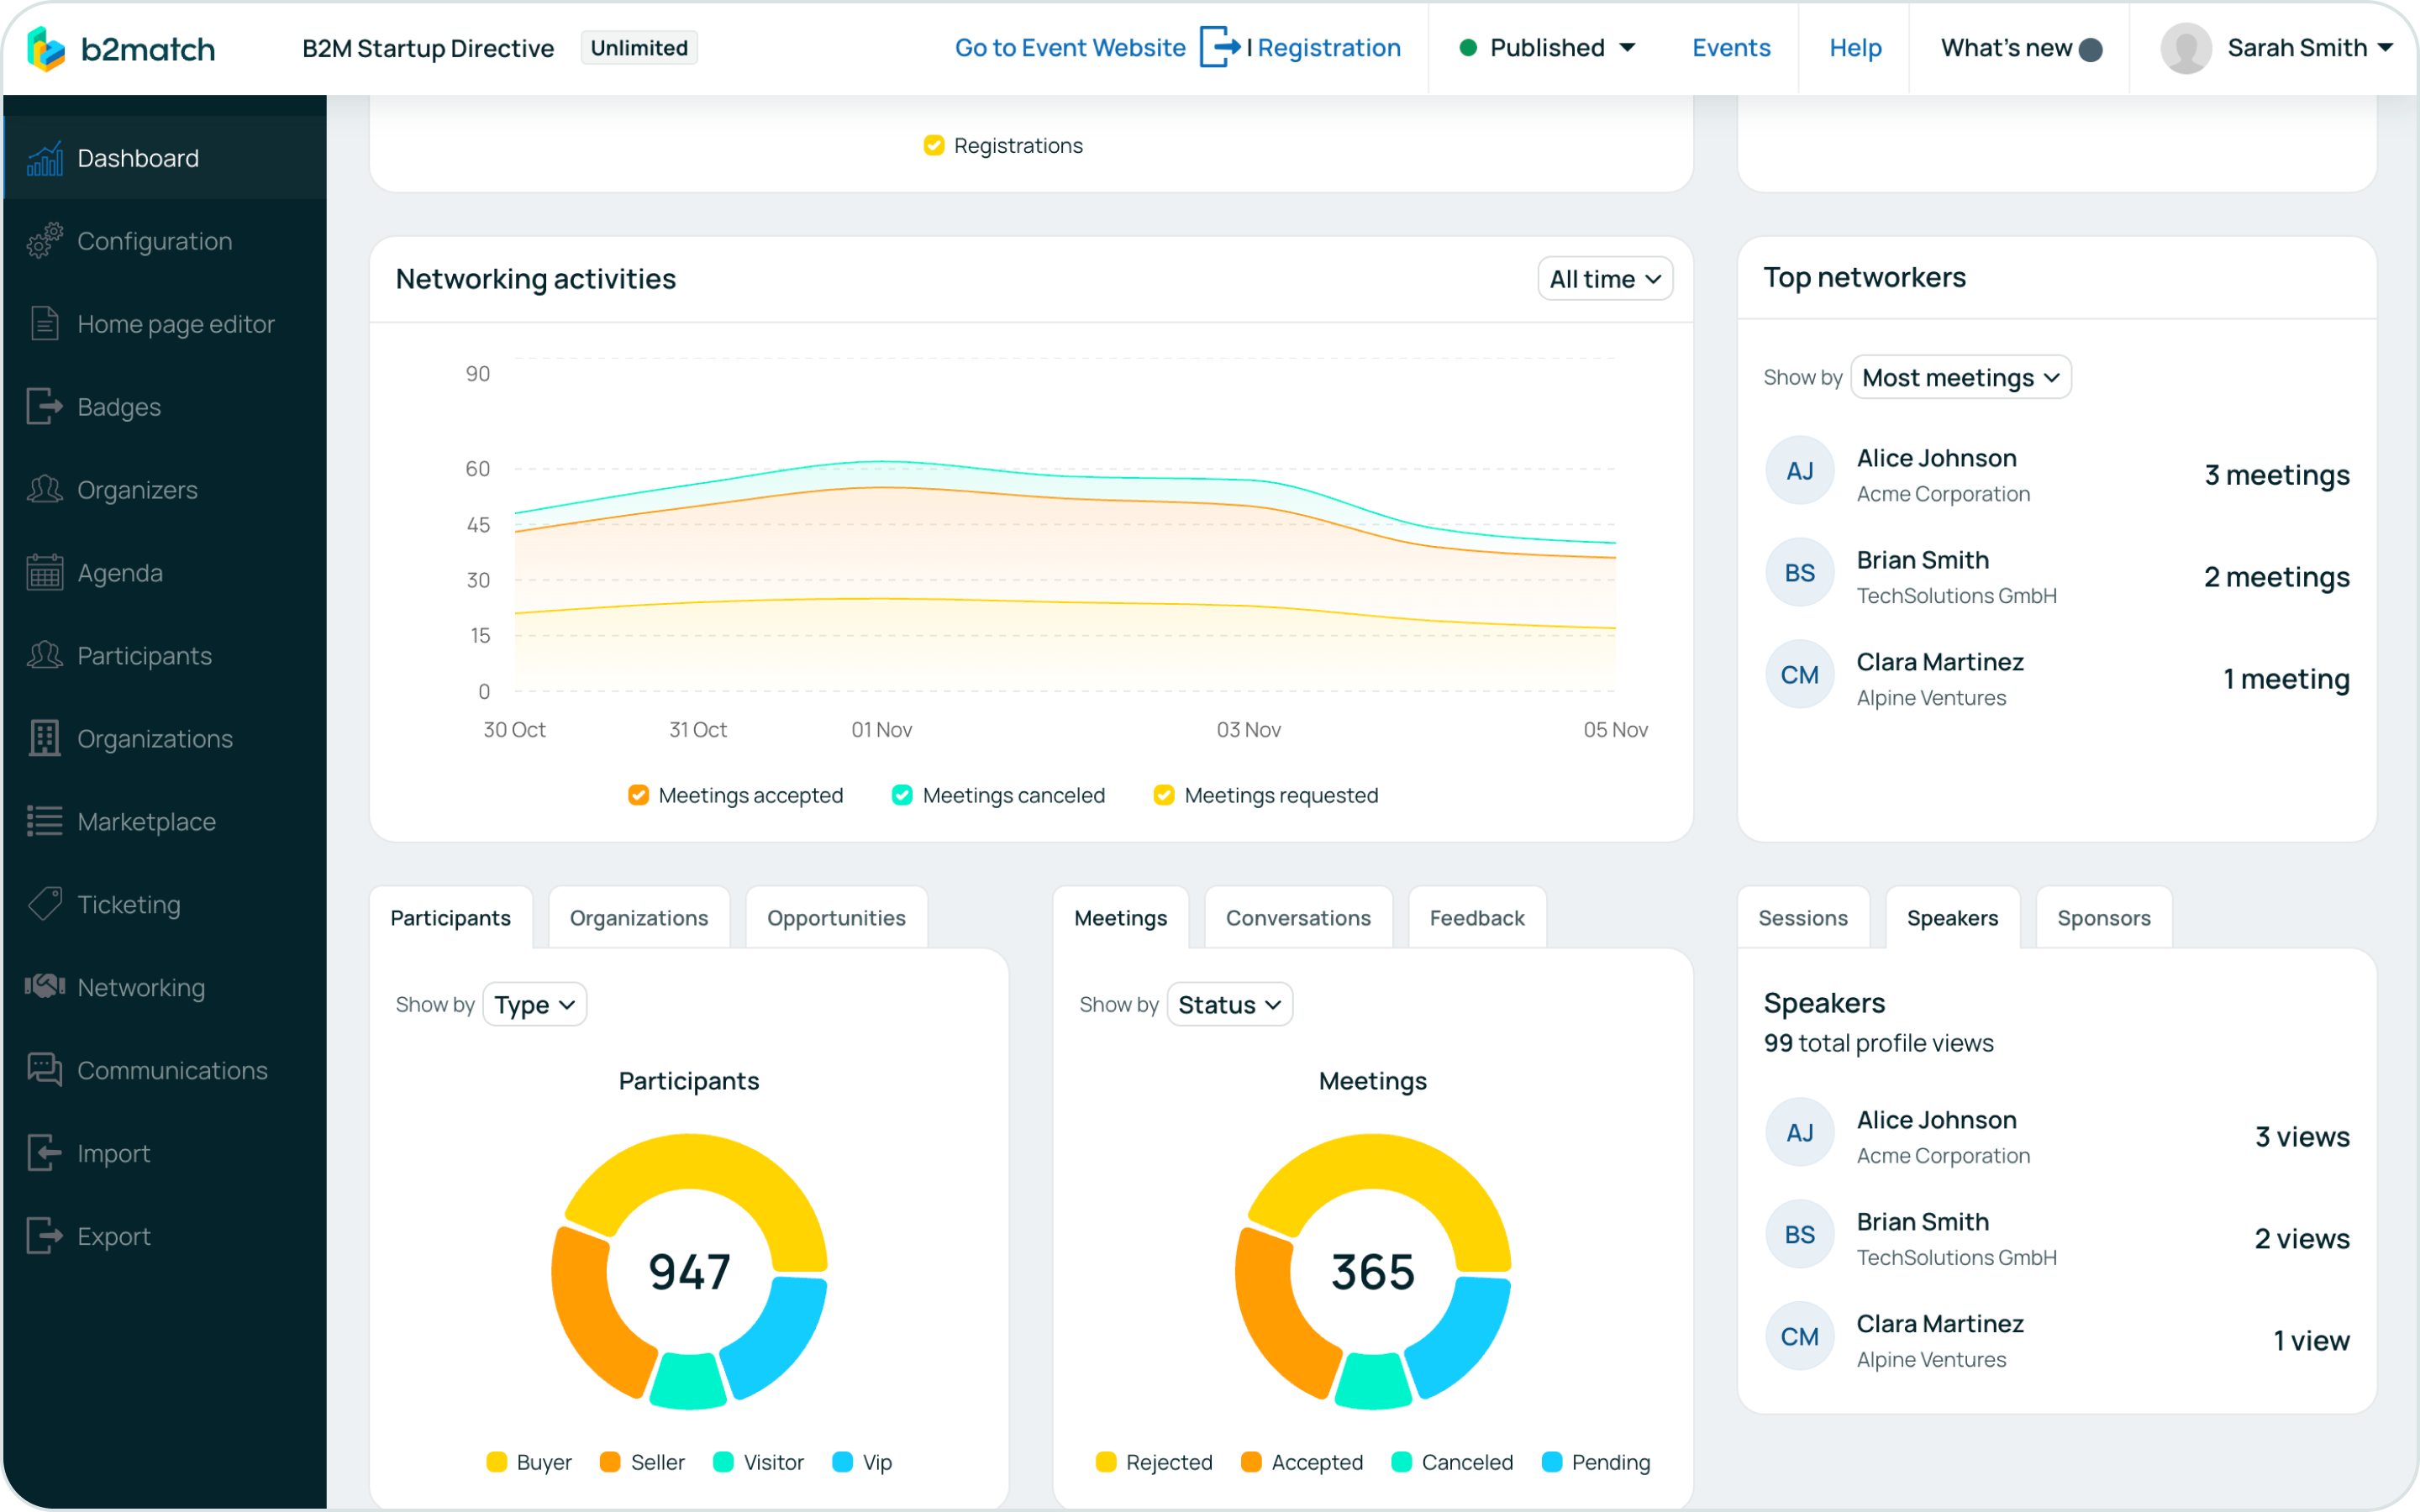
- Networking in motion: Watch your event's connections come to life. The Networking activities graph shows meeting requests, acceptances, and cancellations over time, while the Top Networkers widget highlights your most active participants, sorted by meetings, chat activity, and more.
- Granular data overviews: Dive deeper with widgets that break down your data. Filter participants by type and status, meetings by format, conversations by type and engagement, and more.
- Content & sponsor impact: See what’s resonating most by identifying sessions with the most registrations, and speakers or sponsors with the highest profile views
Built for you, refined with your feedback.
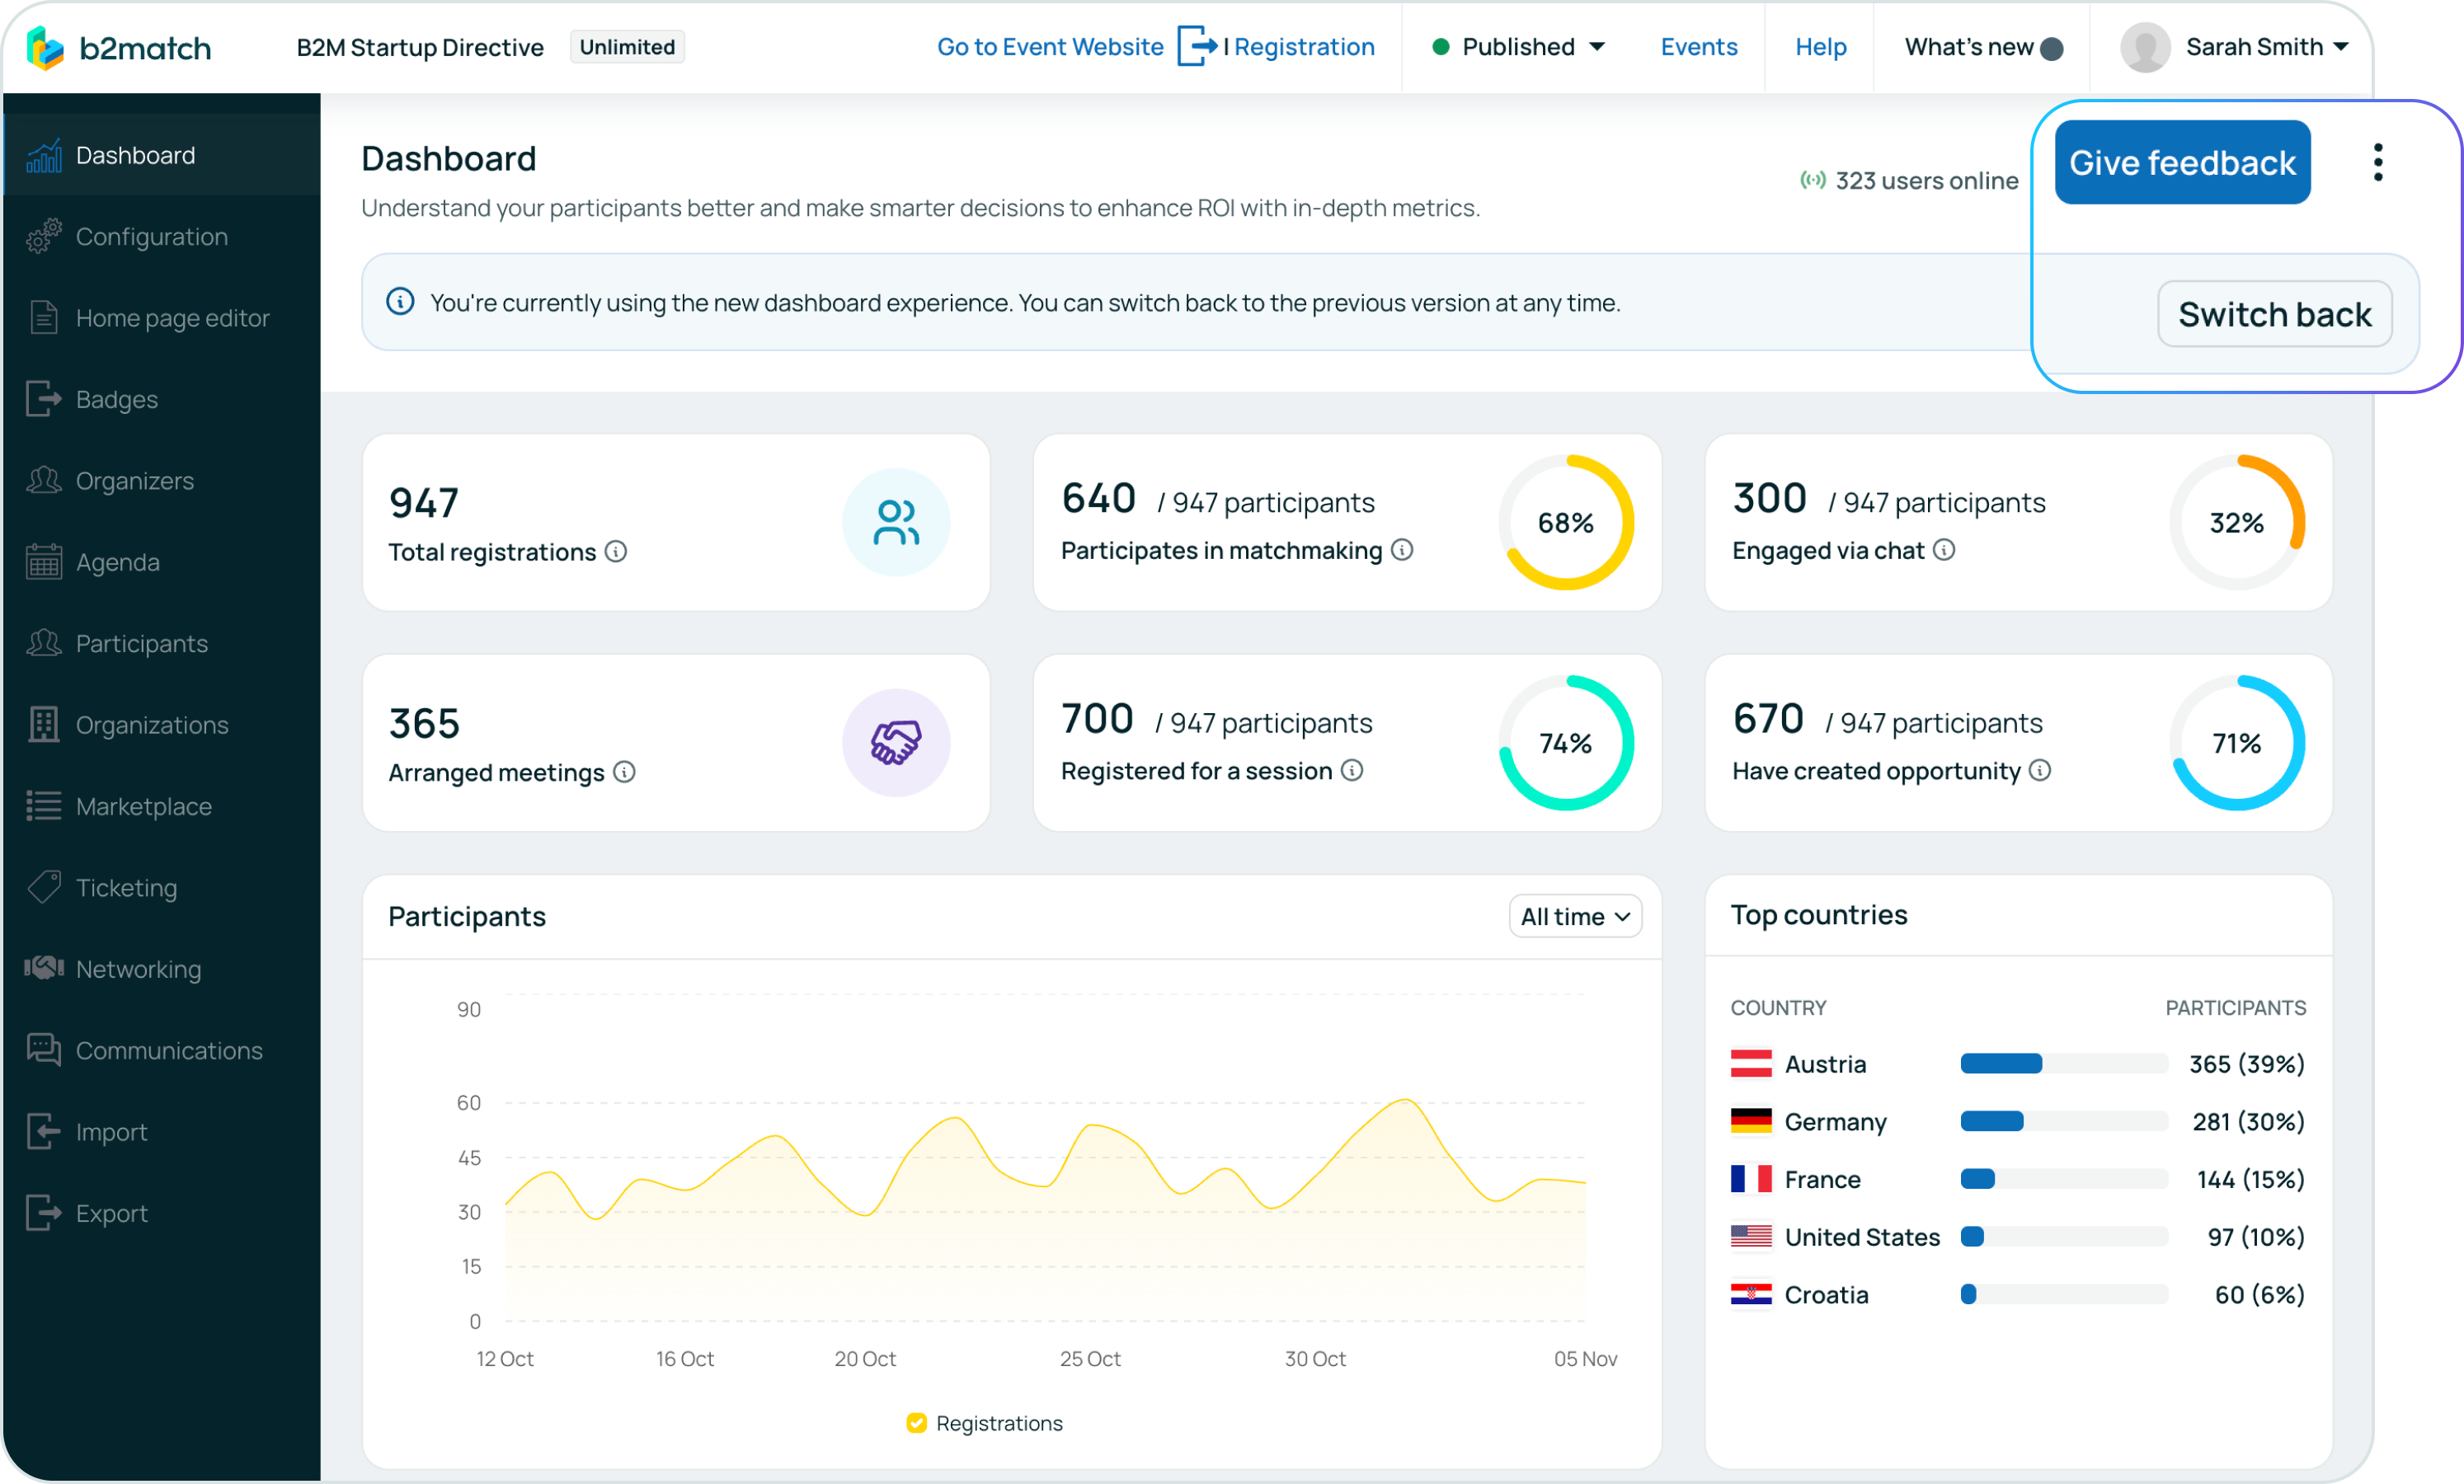
We know that a powerful tool is only as good as its usability. That’s why we’ve made sure the transition is seamless. For those who loved the previous version, a simple “Switch back” button is available.
More importantly, we see this as the start of a conversation. Your experience is invaluable in helping us refine this tool, which is why we’ve included a “Give Feedback” button directly in the dashboard. This is your platform, and we’re committed to building it with you.
This new admin Dashboard is more than just a reporting tool—it’s your strategic partner in event management. It empowers you to move from guessing to knowing, from hoping for engagement to actively understanding and fostering it.
Log in to your b2match account and click on the “Explore” button on your Dashboard page to discover the story your event data is telling you.